In this post we’re going to look at:
- Why LDL cholesterol, and total cholesterol, are weakly associated with cardiovascular disease (CVD).
Which is to say that there is an association, but it’s too weak to be very useful, and too weak for cholesterol to be causative. - Which biomarkers are more strongly associated, and better for predicting cardiovascular disease risk.
The reason that this is relevant, is that some mainstream health providers do propagate the idea that “high cholesterol” is a really bad thing.
Before we go any further, we’ll briefly go through a few mainstream sources that propagate this idea of high cholesterol being “bad”…
For example the British Heart Foundation says:

Source: https://www.bhf.org.uk/informationsupport/risk-factors/high-cholesterol
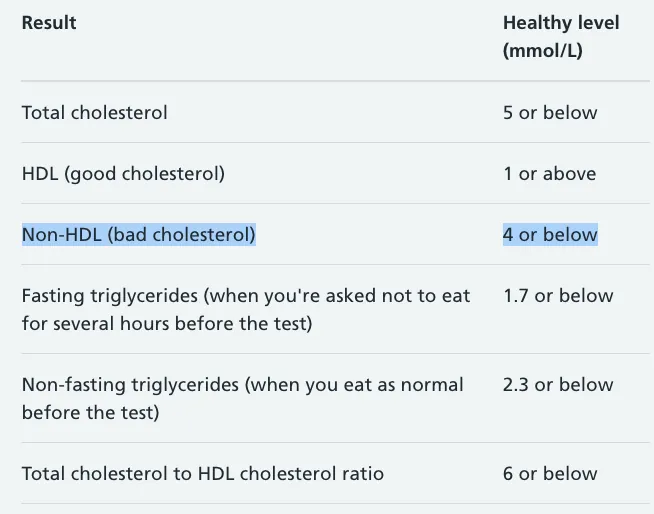
Even more specifically, the UK NHS site says:

Source: https://www.nhs.uk/conditions/high-cholesterol/cholesterol-levels/
And the US CDC says:
Source: https://www.cdc.gov/cholesterol/index.htm
With the CDC going on to specify:

Source: https://www.cdc.gov/cholesterol/ldl_hdl.htm
First, what is the cholesterol hypothesis?
Before we go on to debunk the cholesterol hypothesis, we should probably define it. The cholesterol hypothesis (also referred to as the lipid hypothesis on wikipedia) revolves around the idea that certain types of cholesterol, present in the blood, can lodge themselves in the artery wall, and create a lump (lesion) that narrows the artery and restricts blood flow.
This lump may later get loose, and float around the bloodstream, blocking blood vessels in the heart or brain, and causing heart attacks or strokes.
This illustration below by the Cleveland Clinic in the USA (who I believe have a good reputation) illustrates part of the hypothesis:
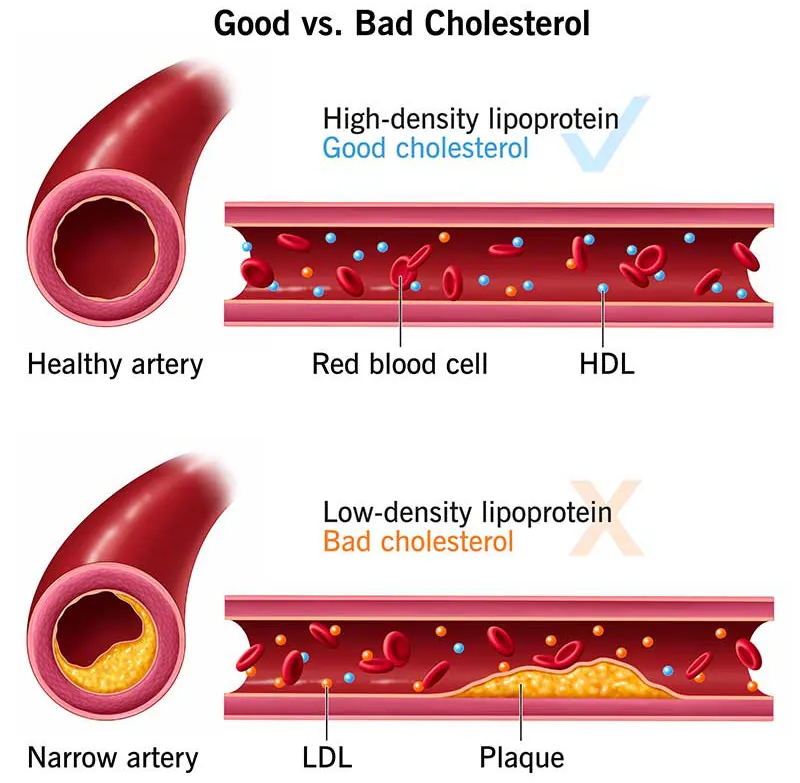
Source: https://my.clevelandclinic.org/health/articles/23922-what-is-cholesterol
Specifically they suggest that some cholesterol is bad (LDL-C) and some is good (HDL-C).
With the lower density cholesterol being more likely to create plaques.
Particles vs Cholesterol Count
Ok, so here’s a weird thing.
If it’s the low density of the particles that triggers the creation of these lesions in artery walls, why (instead) are we measuring LDL-C.
LDL-C is a measure of the cholesterol found in low density lipoproteins, not a measure of how many low density lipoproteins there are.
To use an analogy for a moment, imagine if the lipoproteins are different transport vehicles, and the cholesterol is the number of passengers in that vehicle.
Measuring how many passengers might give us an indication of how many cars or buses there are, but it’s going to be a rough estimate. To really get a clear idea we need to measure the number of vehicles specifically.
This type of analysis is possible, you can measure things like LDL-P, but it’s not part of a routine lipid panel.

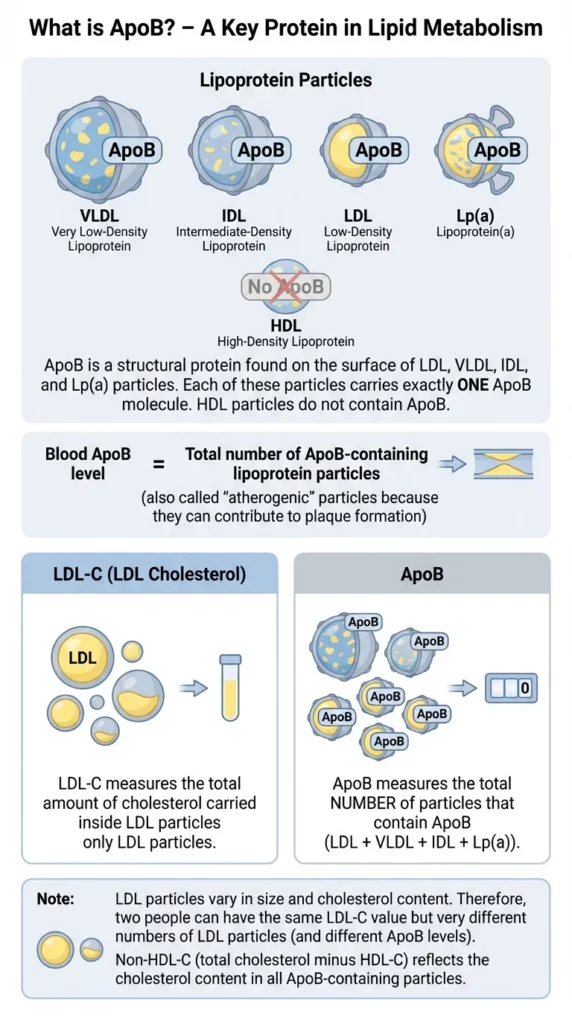
The image above helps explain how measuring LDL-C, not LDL-P, can lead to misunderstandings.
ApoB
When it comes to measuring particle count, it’s possible to count each particle size separately, or, you can instead measure ApoB, which is present across all the particle sizes except for HDL-P.
This is an accurancy improvement in the sense that it looks at more than just the cholesterol content inside lipoproteins, and expands beyond LDL to cover Lp(a), IDL and VLDL.
However, as you’ll see from the below article, it’s still not a great biomarker to assess cardiovascular disease risk:
On to the Research
Ok… so now we are going to look at research which backs up the idea that high LDL cholesterol has a relatively weak correlation with cardiovascular disease (CVD).
Instead, the research show that having low levels of LDL can be very bad itself.
Which is the opposite of what you’d expect if LDL is supposedly bad.
Research suggesting high LDL is a poor biomarker of CVD
Study A1: 15-Year Study of 19,000 NHANES subjects
This paper found that:
- Low LDL is associated with 37% higher risk of death from all causes
- High LDL is associated with 8.7% higher risk of death from all causes
See this image in the paper (Figure 1C):
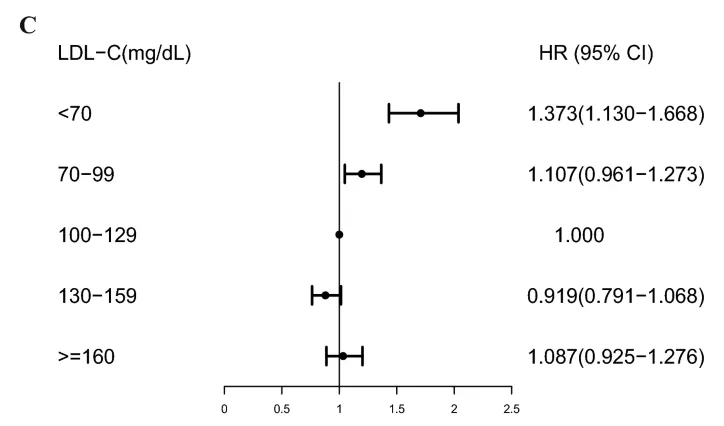
If LDL is “bad”… then you would assume that lowering it would reduce your risk of death, not increase it.
Paper source: https://doi.org/10.1038/s41598-021-01738-w1Association between low density lipoprotein cholesterol and all-cause mortality: results from the NHANES 1999–2014 | Liu et al. | 2021 | Nature – Scientific Reports
Study A2: Analysis of 347,000 Koreans
This study found that < 70 ng/ml of LDL doubled the rates of cardiovascular disease (and cancer also).
Figure 1 shows the risk of all-cause mortality for varying LDL measures:
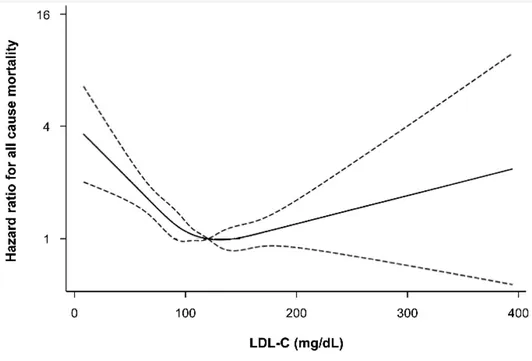
Notice the gradient is sharper on declining LDL levels than increasing.
Paper source: https://doi.org/10.3390/jcm81015712Low Levels of Low-Density Lipoprotein Cholesterol and Mortality Outcomes in Non-Statin Users | Sung et al. | 2019 | Journal of Clinical Medicine
For context, it’s not super common to have an LDL much greater than 200 mg/dL.
For example, NHS reference range says LDL should be 154 mg/dL or below:
Johns Hopkins says very high is 190 mg/dL or above:

If you want to convert between UK (mmol/L) & US (mg/dL) units, you can use this calculator.
Study A3: Analysis of 118,000 UK citizen’s Biobank data
Data from 118,000 UK Biobank participants shows higher LDL associated with less lung cancer, depression, sleep disorders and osteoporosis.
To quote the 2022 paper:
“We note that low-density lipoprotein (LDL) cholesterol and apolipoprotein B displayed inverse associations across a wide range of diseases, i.e. higher concentration was associated with lower risk for disease incidence (Figure 5). This observation, which is surprising compared to existing literature on LDL as a risk factor“.
Figure 5:

I found the image above a bit confusing to read at the start. Here’s some help in interpreting it.
On the x-axis, at the bottom, is the hazard ratio. Under one makes the risk lower, and above 1 makes the risk higher. In this context, we see that higher levels of LDL cholesterol make the risk of everything lower, except for heart attacks (myocardial infarctions), for which there’s a slightly elevated risk.
Note that higher triglycerides consistently results in greater risk of everything, except for osteoporosis.
Paper source: https://doi.org/10.1101/2022.06.13.222763323Atlas of plasma nuclear magnetic resonance biomarkers for health and disease in 118,461 individuals from the UK Biobank | Julkunen et al. | 2022 | Medrxiv preprint
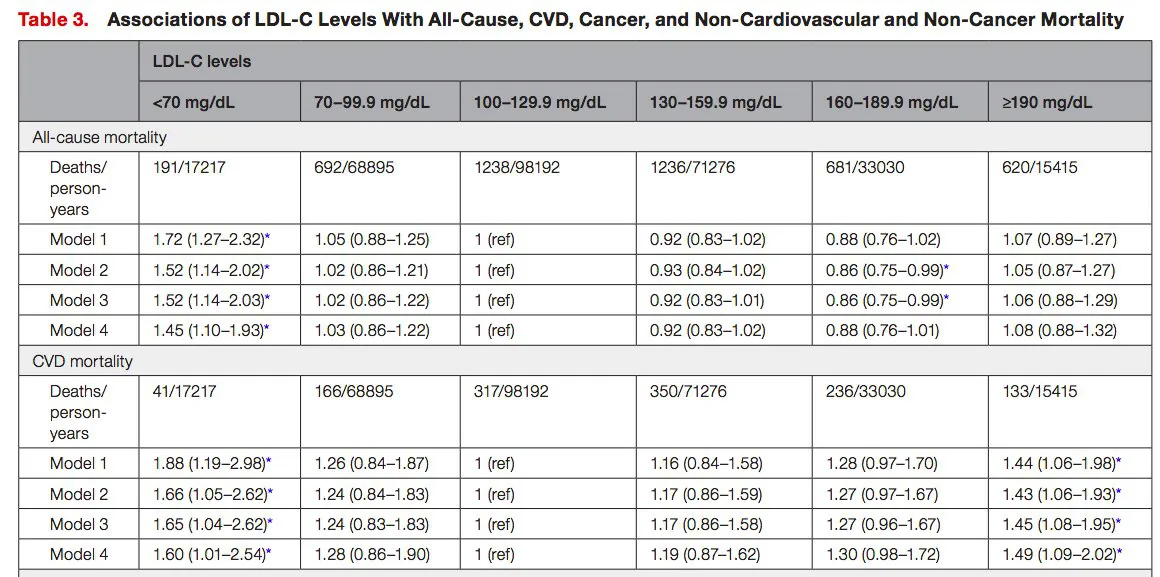
Study A4: ~20 year follow-up of 14,000 Americans
This study showed that low LDL and very high LDL increased all-cause mortality.
But high LDL (160-189), that would usually be considered too high, actually reduced risk of death from all causes.
Quote:
“Both very low and very high LDL‐C levels were associated with increased risks of CVD mortality. Very low LDL‐C levels was also associated with the high risks of all‐cause and stroke mortality.”
Note that whilst “very high” LDL-C shows an increase in all-cause mortality… we’re talking around 8% increase. However, even though the NHS says anything under 154 mg/dL is optimal… this data shows that under 100 mg/dL you’ve got a 3% increase in all-cause mortality, and under 70 mg/dL it’s closer to 45%.
Again, if the narrative that LDL cholesterol is causative for heart disease, you should not see lower levels of it vastly increasing all-cause mortality.
Paper Source: https://doi.org/10.1161/JAHA.121.0236904Association of Low‐Density Lipoprotein Cholesterol Levels with More than 20‐Year Risk of Cardiovascular and All‐Cause Mortality in the General Population | Rong et al. | 2022 | Journal of the American Heart Association
Study A5: Analysis of 136,905 hospitalized patients with coronary artery disease
As per the title, this paper looked at 136,905 hospitalized patients with coronary artery disease, which a core component of cardiovascular disease.
Almost half had LDL levels < 100 mg/dL – which is considered optimal by both the NHS and Johns Hopkins sources we looked at above. Yet they were still hospitalized with cardiovascular disease…
Paper Source: https://doi.org/10.1016/j.ahj.2008.08.0105Lipid levels in patients hospitalized with coronary artery disease: An analysis of 136,905 hospitalizations in Get With The Guidelines | Sachdeva et al. | 2009 | American Heart Journal
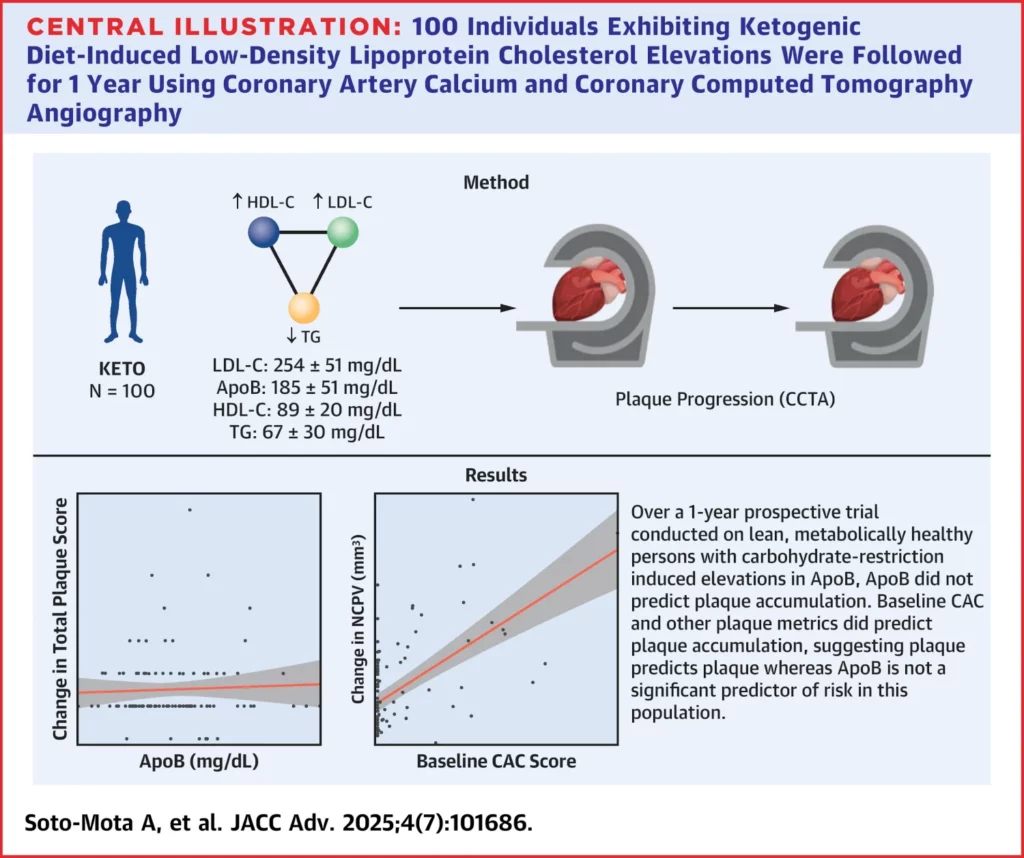
Study A6 – Examining high LDL vs low LDL in healthy people
So, what happens when you take a group of people eating a diet that is high in saturated fat, which then elevates their LDL cholesterol levels much higher than “normal”, but those people are otherwise healthy people.
An American study looked to do just that.
This diagram from the study explains it quicker and more simply than I will:

They found that the LDL-C number didn’t make a difference to plaque in these healthy people.
Then, a follow-up study again found the same result (but via a slightly different method).
Again, see their excellent infographic for how that study worked:
Research suggesting high Total Cholesterol is a poor biomarker of CVD
In the previous section we looked at studies related to LDL cholesterol, and so in this section we’ll look at studies related to total cholesterol.
Total cholesterol is made up of LDL, HDL and VLDL cholesterol.
Similar to the story with LDL, having “high” total cholesterol is not necessarily problematic.
However, having low total cholesterol is problematic.
Study B1: 10 year follow-up study 52,000 Norwegians
This study found that higher levels of total cholesterol resulted in lower rates of mortality. See figure 3 of the paper:

Again, to explain the graph you’re looking at. Total cholesterol levels under 5.0 mmol/L are the baseline, and then as the total cholesterol level increases, the hazard ratio (risk of death from all causes) decreases.
Paper Source: https://doi.org/10.1111/j.1365-2753.2011.01767.x6Is the use of cholesterol in mortality risk algorithms in clinical guidelines valid? Ten years prospective data from the Norwegian HUNT 2 study | Petursson et al. | 2011 | Journal of Evaluation in Clinical Practice
Study B2: Analysis of 12 million Koreans
This huge study produced results like the below graphs, showing the association between levels of total cholesterol and risk of death from all causes.

For example, if we refer back to the NHS chart we looked at above, it said that a total cholesterol level of under 5 mmol/L was healthy. 5 mmol/L is 193 mg/dL (using convertor).

This study directly contradicts the NHS advice. The study shows that a total cholesterol of around 215 – 245 mg/dL is associated with the lowest risk of death from all causes.

Paper Source: https://doi.org/10.1038/s41598-018-38461-y7Total cholesterol and all-cause mortality by sex and age: a prospective cohort study among 12.8 million adults | Yi et al. | 2019 | Nature – Scientific Reports
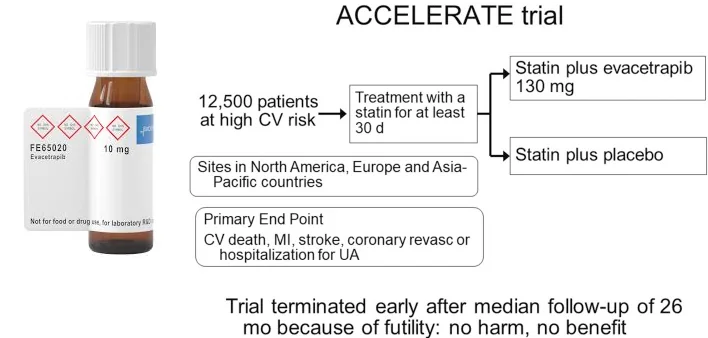
Study B3: A drug that lowers LDL fails to prevent cardiovascular disease
Eli Lilly created a drug called evacetrapib, which lowers LDL cholesterol and increases HDL.
Sounds perfect, right?
However, when they took it to phase 3 trials in 12,000 patients, they found the drug performed no better than placebo.
That’s weird, no? Shouldn’t it be a blockbuster job if the cholesterol hypothesis is correct?
But no, it didn’t make people healthier, and thus it didn’t reach the market.
You can read more about the study here.
So what to look at instead?
Above we’ve looked at 2 biomarkers that appears to be misunderstood.
Whilst some of their ranges do have a loose correlation with all-cause mortality, generally speaking, they’re not very predictive.
Enter triglycerides…
You may remember that in study 3, we saw that elevated triglycerides correlated strong with all diseases except osteoporosis.
Triglycerides are fat molecules that float about in the bloodstream. They’re essential to healthy function in all humans, but having elevated levels of them is not good.
Elevated triglyceride levels have a strong correlation with insulin-resistance8Insulin Resistance and Triglycerides | Glueck et al. | 2009 | BMJ – Journal of Investigative Medicine.
Indeed, fasting triglyceride levels are sometimes combined with fasting glucose levels (called the triglyceride glucose (TyG) index) to establish insulin resistance9The Product of Fasting Glucose and Triglycerides As Surrogate for Identifying Insulin Resistance in Apparently Healthy Subjects | Simental-Mendía et al. | 2008 | Metabolic Syndrome and Related Disorders.
This is sometimes quicker and cheaper than the HOMA-IR test, which directly measures insulin resistance.
Whilst there is strong correlation with the TyG index and cardiovascular disease, perhaps the most useful marker (that can be derived from a lipid panel) is triglycerides divided by HDL.
This is a very useful marker, because triglycerides and HDL are measured as standard on lipid panels. Meaning no extra, expensive tests are required.

We’ll come back to “what is a good score” later.
First, let’s reinforce this concept by looking at some studies that demonstrate the correlation between this metric and cardiovascular disease.
Study C1: Association Between Coronary Disease & Lipid Biomarkers
This study looked at 374 subjects who were due to undergo a scan of the heart (called an angiography) to check for coronary disease.
Coronary disease is one aspect of cardiovascular disease, where the blood vessels supplying the heart get narrowed due to atherosclerotic plaques.
After scanning the subjects, they then classified the extent of their coronary disease using Freisinger index. With 0 meaning no abnormalities and 5 being the worst, where there is an occlusion requiring medical intervention (specifically an angioplasty, aka a stent, most likely).
Then they looked at correlations between lipid biomarkers and subjects with bad lesions (Freisinger index of >4).
The below graph shows that the biomarker with the highest correlation was Triglycerides / HDL. OR means odds ratio, and is way to represent an association between two things.

They conclude by saying:
“Although some lipid variables were associated with the extent of coronary disease, the ratio of triglycerides to HDL-cholesterol showed the strongest association with extent”.
Paper Source: https://doi.org/10.1590%2FS1807-5932200800040000310High Ratio of Triglycerides to HDL-Cholesterol Predicts Extensive Coronary Disease | Lemos da Luz et al. | 2008 | Clinics Journal
Study C2: Trigs/HDL predicts heart disease despite other risk factors
This study looked at 2,900 men over 8 years – comparing traditional risk factors, such as high LDL, with triglycerides divided by HDL.
They found that Trigs/HDL was more predictive of ischemic heart disease (IHD) than LDL scores. See the chart below (Figure 1 in the paper):

If LDL was strongly predictive of cardiovascular disease, we would expect to see a bigger difference in the incidence of ischemic heart disease (IHD) between the two groups.
Paper Source: https://doi.org/10.1001/archinte.161.3.36111Low Triglycerides–High High-Density Lipoprotein Cholesterol and Risk of Ischemic Heart Disease | Jeppesen et al. | 2001 | JAMA
Study C3: Korean study of 16,455 over 4 years
This study stratified 16,455 korean men and women into 4 groups of triglycerides divided by HDL.
In the 50 month follow-up period there were 321 incidents of ischemic heart disease (IHD), and when they looked at which groups they came from.
They found that those in the group with the highest Trigs/HDL group had 2.29x higher risk than those in the lowest group.
It’s worth mentioning that over a long enough time scale, every human will succumb to cardiovascular disease (if something doesn’t get them first). So what’s relevant with these biomarkers, is which will reduce the risk as much as possible.
This graph from the study shows the relative risk depending on which group the subjects were in. Red was the group with the lowest scores, black with the highest:

To give that image above more context, these are the Trigs/HDL ranges for the various groups:
- Group 1 (Q1) = <1.25
- Group 2 = 1.26-1.98
- Group 3 = 1.99-3.24
- Group 4 (Q4) = >3.25
Interestingly, this study found a noticeable difference in risk between men and women in the highest group. Men had a 1.8x increase and women had a 2.98x increase.
Paper Source: https://doi.org/10.3389/fcvm.2021.71669812Triglyceride to HDL-Cholesterol Ratio and the Incident Risk of Ischemic Heart Disease Among Koreans Without Diabetes: A Longitudinal Study Using National Health Insurance Data | Park et al. | 2021 | Frontiers in Cardiovascular Medicine
Study C4: Fitness + Trigs/HDL Ratio
This study looked at the interaction of cardiorespiratory fitness and the Trigs/HDL ratio. It’s worth noting that often this ratio is referred to as TG:HDL-C. However, I think Trigs/HDL is easier to understand, so I’ve been using that name.
The reason I believe the study is interesting, is that generally speaking, people say that physical activity is one of the most important things you can do for your health. Which is true.
And the study shows that physical activity attenuates some of the negative effects of a high Trigs/HDL score. Ie, staying fit and mobile, on its own, decreases cardiovascular disease risk.
But what was more impressive to me, is that those with high Trigs/HDL ratios (>3.90) and high levels of activity, had about the same risk of coronary heart disease mortality, as compared to the least active people in the low Trigs/HDL ratio group.
That is to say… staying fit and active, without having a good Trigs/HDL ratio, is not enough if you want to really reduce cardiovascular disease risk.
In case anyone is curious about the fitness test they used, it was a “modified Balke treadmill protocol”. This consisted of walking on the treadmill with the incline at zero, then gradually increasing the incline by 1% every minute, until they need to stop. Those overseeing the study then stratified people based on percentages, so bottom 20% are the lowest fitness group (L), next 40% are moderate fitness (M), and top 40% are fittest (H).

Image source – Figure 1 of the paper.
Paper Source: https://doi.org/10.1016/j.mayocp.2017.08.01513Moderate to High Levels of Cardiorespiratory Fitness Attenuate the Effects of Triglyceride to High-Density Lipoprotein Cholesterol Ratio on Coronary Heart Disease Mortality in Men | Farrell et al. | 2017 | Mayo Clinic Proceedings
What is a good Trigs/HDL score?
In terms of the Trigs/HDL score, lower is generally better.
To get more specific, we can look at study 10 above, which categorized people into the following groups:
- Group 1 (low) = <1.25
- Group 2 = 1.26-1.98
- Group 3 = 1.99-3.24
- Group 4 (high) = >3.25
As a reminder, the highest group (4) had 2.29x higher risk than those in the lowest group (1).
Therefore, I think we can safely say that <1.25 is ideal, and higher than 2 is sub-optimal. I’m aware of people with a score of 0.5, which is about as good as it gets I think.
Roundup
So in the above post we have looked at:
- How LDL and total cholesterol have a weak association with cardiovascular disease.
- How the situation is worse than just a “weak association”, because if people try to optimize for low cholesterol they vastly increase their risk of dying from all-causes.
- How when a drug company came up with a drug to reduce LDL and increase HDL, it did no better than the placebo in Phase 3 trials.
- How Triglycerides divided by HDL (Trigs/HDL) is a readily available alternative biomarker, that’s highly predictive of cardiovascular disease risk.
- How it uses biomarkers from standard lipid panels. No fancy, expensive tests needed.
Let me know if you have any thoughts on the above in the comments.
Acknowledgements
A lot of the research I’ve compiled above came via two people:
- P.D. Mangan – who’s very active on his Twitter, and has a great blog. Particularly his two posts “The Most Important Lipid Panel Marker” and “Is Insulin Resistance the Main Cause of Heart Disease?” were very helpful in writing this post.
- Malcolm Kendrick – who writes a great blog and wrote a fantastic book on cardiovascular disease called The Clot Thickens.
So hat tip to them for their hard work and research.
References
- 1Association between low density lipoprotein cholesterol and all-cause mortality: results from the NHANES 1999–2014 | Liu et al. | 2021 | Nature – Scientific Reports
- 2Low Levels of Low-Density Lipoprotein Cholesterol and Mortality Outcomes in Non-Statin Users | Sung et al. | 2019 | Journal of Clinical Medicine
- 3Atlas of plasma nuclear magnetic resonance biomarkers for health and disease in 118,461 individuals from the UK Biobank | Julkunen et al. | 2022 | Medrxiv preprint
- 4Association of Low‐Density Lipoprotein Cholesterol Levels with More than 20‐Year Risk of Cardiovascular and All‐Cause Mortality in the General Population | Rong et al. | 2022 | Journal of the American Heart Association
- 5Lipid levels in patients hospitalized with coronary artery disease: An analysis of 136,905 hospitalizations in Get With The Guidelines | Sachdeva et al. | 2009 | American Heart Journal
- 6Is the use of cholesterol in mortality risk algorithms in clinical guidelines valid? Ten years prospective data from the Norwegian HUNT 2 study | Petursson et al. | 2011 | Journal of Evaluation in Clinical Practice
- 7Total cholesterol and all-cause mortality by sex and age: a prospective cohort study among 12.8 million adults | Yi et al. | 2019 | Nature – Scientific Reports
- 8Insulin Resistance and Triglycerides | Glueck et al. | 2009 | BMJ – Journal of Investigative Medicine
- 9The Product of Fasting Glucose and Triglycerides As Surrogate for Identifying Insulin Resistance in Apparently Healthy Subjects | Simental-Mendía et al. | 2008 | Metabolic Syndrome and Related Disorders
- 10High Ratio of Triglycerides to HDL-Cholesterol Predicts Extensive Coronary Disease | Lemos da Luz et al. | 2008 | Clinics Journal
- 11Low Triglycerides–High High-Density Lipoprotein Cholesterol and Risk of Ischemic Heart Disease | Jeppesen et al. | 2001 | JAMA
- 12Triglyceride to HDL-Cholesterol Ratio and the Incident Risk of Ischemic Heart Disease Among Koreans Without Diabetes: A Longitudinal Study Using National Health Insurance Data | Park et al. | 2021 | Frontiers in Cardiovascular Medicine
- 13Moderate to High Levels of Cardiorespiratory Fitness Attenuate the Effects of Triglyceride to High-Density Lipoprotein Cholesterol Ratio on Coronary Heart Disease Mortality in Men | Farrell et al. | 2017 | Mayo Clinic Proceedings